
U.S. Sources Of Energy

The chart at the left shows the 2017 total energy use in the U.S. by its source. All data in this section comes from the Energy Information Administration (EIA) which is part of the Department Of Energy (DOE). The raw data is available in great detail. During 2017 there was very little change from 2016. Renewables increased by one percent and coal dropped one percent. Renewables can be further broken down as follows: biomass 45%, hydroelectric power 25%, wind 21%, solar 6%, and geothermal 2%.
In 2017 the United States was the world leader in the production of petroleum or oil (13.0%), followed by Saudi Arabia (12.8%), Russia (12.6%), Canada (5.4%) and Iran (5.3%).
The world total of oil production was 4,387 million metric tons, of which the United State contributed 571. So no one really totally dominates oil production, but the big three are dominant.
Coal production peaked in 2008 and then trended down through 2017. Coal production in 2017 was about equal to production in 1979 - 38 years ago. . The main reason for the general decline in U.S. coal production is the decrease in U.S. coal consumption for electricity generation. Top
U.S. Energy Consumption
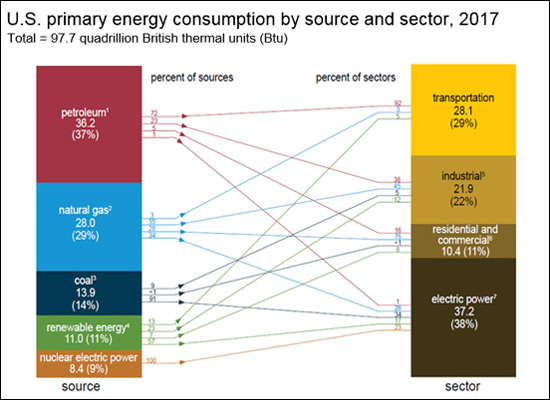
The chart to the left is fairly complicated. The column at the left hand side (source) is the same info as the circle above. The column at the right is U.S. energy consumption by major sector.
Electric power is the biggest user of energy at 38%. Next comes transportation at 29% followed by industrial at 22%, with residential at 6% and commercial at 5%. (For our purposes you can ignore the arrows in the middle.)
72% of all the petroleum consumed goes into the transportation sector as fuel and a lubricant for cars and trucks. While this is not a surprise, we pretty much take gasoline for granted and most people do not realize that petroleum is the number one source of energy in the U.S. The industrial sector uses 23% of petroleum sources making the top two sectors, transportation and industrial, total 95% of all petroleum consumption.
The electric power sector (38% consumption) generates most of the electricity in the United States, and the industrial, residential and commercial sectors consume most of that electricity. The sources of energy for electric power is discussed in the next section. Top
US Electricity By Source
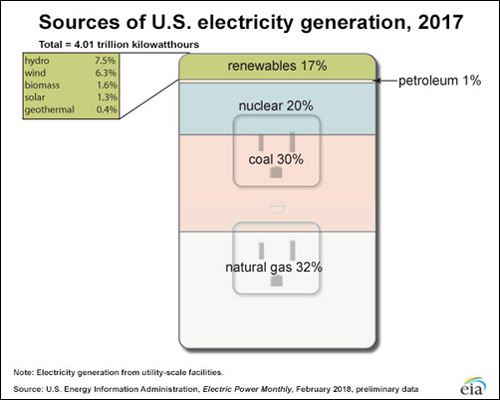
The three major categories of energy for electricity generation are fossil fuels (which are coal, natural gas, and petroleum), nuclear energy, and renewable energy sources. Most electricity is generated by steam turbines using fossil fuels and nuclear energy. Other electricity generation technologies include gas turbines, hydro turbines, wind turbines, and solar photovoltaics.
In 2017 natural gas was the largest fuel, 32%, for U.S. electricity generation. Natural gas is used in steam turbines and gas turbines to generate electricity.
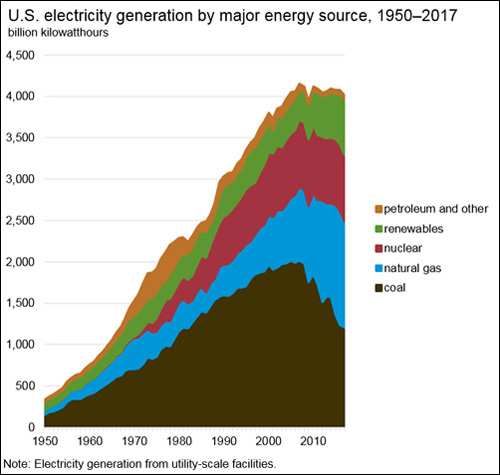
While coal had been the largest source of electricity generation in the United States for over 60 years, its share of total generation declined from 50% in 2007 to 30% in 2017. Coal-fired generation is now number two, its use declined due to strong price competition from natural gas, increased use of renewable energies, and most important - new environmental regulations. There are currently no new coal-fired plants being built or planned. Nearly all coal-fired power plants use steam turbines.
Nuclear energy was the source of about 20% of U.S. electricity generation in 2017. Nuclear power plants use steam turbines to produce electricity from nuclear fission.
The 1% use of petroleum (oil) for electricity generation occurs mainly in Hawaii because most of its energy must be imported.
In 2017 the largest share of electricity generated by "renewables" (17%) came from hydroelectric power (7.5%), followed by wind (6.3%), biomass waste (1.6%), solar (1.3%), and geothermal (0.4%).
Nearly all hydroelectric capacity was built before the mid-1970s, and most of it comes from dams that are operated by federal agencies.
The amount of electricity generated by wind has increased substantially in the past decade. This increase is largely attributed to the availability of federal financial incentives and renewable energy goals mandated by many state governments.
Biomass waste is mostly municipal solid waste that is burned in waste-to-energy power plants. Most electricity generation from wood biomass occurs at lumber and paper mills. These facilities use wood waste to provide much of their own steam and electricity needs.
Solar energy provided about 1.3% of U.S. electricity in 2017. Photovoltaic (PV) and solar-thermal power are the two main types of solar electricity generation technologies. PV conversion produces electricity directly from sunlight in a photovoltaic cell. Most solar-thermal power systems use steam turbines to generate electricity.
Geothermal power plants produced 0.4% of the U.S. electricity in 2017. Geothermal energy is the natural heat found below the earth's surface - hot water and hot rock a few miles beneath the surface. It is clean and sustainable. Geothermal power plants use steam turbines to generate electricity.
Approximately 27% of the energy used for electricity in the US is lost due to power production and grid transmission. The grid in the United States needs two major upgrades in the long run. First, we must switch all of our long distance transmission lines to high voltage which are much more efficient. Second, as more energy is derived from renewable sources, the grid must be able to store energy from the sun and wind. The system has to have the intelligence to store excess energy from the sun and wind for night time use or for cloudy days. These are difficult problems, but they need to be solved. Top
World Electricity
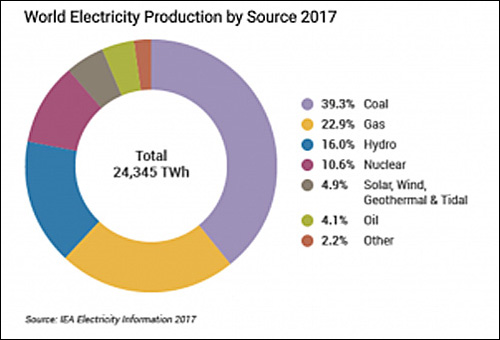
Shown at the left is an estimate by the EIA (U.S. Energy Information Administration) of 2017 world wide electricity generation. Power systems continue to evolve from isolated, non-competitive grids tolarge integrated national ones.
To the left below is the EIA electricity generation forecast out to 2040. From 2015 to2040 world electricity generation increases by 45%, rising from 23.4 trillion kilowatt hours (kWh) in 2015 to 34.0 trillion kWh in 2040. The balance of this section will focus on the details of the EIA's world wide forecast.
The strongest growth in electricity generation is projected to occur from developing non-OECD (Organization for Economic Cooperation and Development) nations. Increases in electricity generation in non-OECD countries (including China and India) average 1.9% per year as rising living standards increase demand for home appliances and electronic devices; and for commercial services, including hospitals, schools, office buildings, and shopping malls.
In the OECD nations, where infrastructures are more mature and population growth is relatively slow, electric power generation increases by an average of only 1.0% per year.
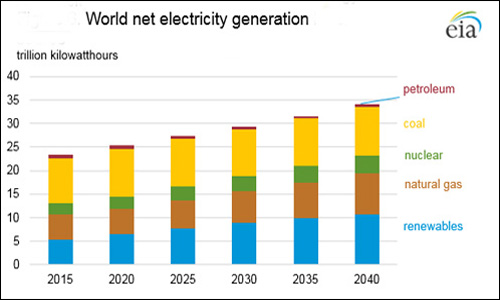
Contrary to the U.S., where natural gas is number one, coal is the unquestioned world wide number one provider of electricity and will continue to be so for the near future. In the industrial countries of the west, the use of coal will shrink. However, in very fast developing countries, like China and India, coal will increase modestly as a source of fuel. Both countries are making an effort to reduce their dependance on coal and are moving forward aggressively with renewables.
Coal-fired net generation increases by only 0.4% per year, compared to the 2.8% per year increase in projected renewable generation. By 2040, generation from renewable energy sources surpasses generation from coal on a worldwide basis.
Long-term global prospects continue to improve for electrical generation from renewable energy sources and natural gas. Renewables are the fastest growing class of electricity generation, with average increases of 2.8% per year from 2015 to 2040. But the sun and wind are variable and must be backed up by quick changes in generation which can only be done with natural gas. After renewable energy sources, natural gas and nuclear power are the next fastest growing sources of energy for electrical generation. Natural gas is up 78% in the forecast and is the back up source of choice for renewables.
Nuclear is up 74% reflecting its low emissions profile and its ability to be available 90% of the time day or night. However, after the Japanese problems at Fukushima, many countries (lead by Germany) are re-thinking their nuclear strategies. Nuclear powered electricity increases from 2.5 to 3.2 trillion kWh in 2030 and to 3.7 trillion kWh in 2040. Virtually all of the projected net expansion in world nuclear power capacity occurs in non-OECD countries, led by China’s addition of 111 gigawatts of nuclear capacity from 2015 to 2040. Concerns about energy security and greenhouse gas emissions support the development of new nuclear generating capacity, but reactor retirements and opposition from local populations keep nuclear from expanding in many parts of the world. Top
Sun And Wind Are Complementary
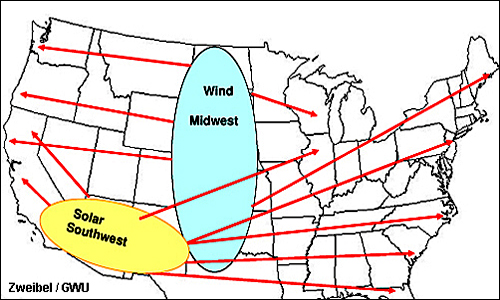
The chart at the left shows the sun and wind energy centers in the United States. The southwest is strong in solar and the Midwest is strong in wind.
Solar energy is a daylight phenomenon whereas wind energy in the plains is strongest at night. Solar is stronger in the summer; while winds are stronger in the winter.
Ken Zweibel formerly of George Washington University has suggested building "super electrical highways" analogous to the interstate road system to supply electricity on high voltage transmission lines from the sources of sun and wind to far away places like Maine and the East Coast.
Electricity could be sent from Arizona to Maine with transmission losses of only 11% along these super electrical highways. Top
Solar Power Is Our Most Abundant Resource
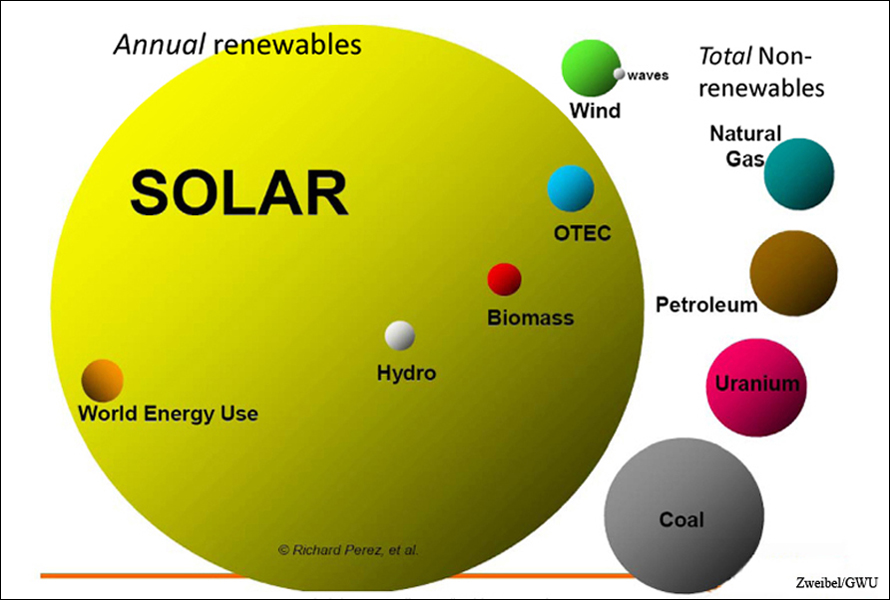
The sun is our best source of energy by far. It dwarfs all other sources of power. The sun's total energy falling through the atmosphere to the earth in one year is approximately 4,000 times the current yearly energy usage by all of mankind. All the energy stored in the earth's reserves of coal, uranium, petroleum, and natural gas is equivalent to the energy from just 20 days of sunshine. Averaged over the entire surface of the earth, 24 hours per day for a year, each square meter collects the approximate energy equivalent of a barrel of oil each year. This converts to a 4.2 average kilowatt-hours of energy every day.
The average figure varies by location, season and weather patterns. Deserts, with very dry air and little cloud cover, average the most sun - more than 6 kilowatt-hours per day per square meter. Northern climes, such as that of Boston, receive about 3.6 kilowatt-hours, which is 15% less than the 4.2 kilowatt-hours average. Sunlight varies by season and location as well, with some areas receiving very little sunshine in the winter. Seattle in December for exa mple, receives only about 0.7 kilowatt-hours per day.
Top